Best Greyhound Betting Sites – Bet on Greyhounds in 2026
- Trap Colours: The Universal Identification System
- Greyhound Information: Name, Age, Colour and Pedigree
- Trainer and Kennel Data
- Form Figures: Reading the Recent Race History
- Sectional Times and Pace Analysis
- Comment Abbreviations: The Language of Race Reports
- Putting It All Together: Practical Racecard Analysis
Learning how to read a greyhound racecard is the foundation of understanding UK greyhound racing. Every racecard contains fifteen or more distinct data points about each dog, from trap number to recent form, from weight fluctuations to running comments. Without the ability to decode this information, watching a race is little more than guessing which colour jacket looks luckiest.
The racecard serves as a compressed biography of each greyhound’s racing career. It tells you where the dog has been running, how quickly it has been running there, and whether its recent performances suggest improvement or decline. British racecards follow a standardised format across all eighteen GBGB-licensed stadiums, meaning once you learn to read one, you can read them all. That consistency matters when you are comparing dogs that have raced at different venues.
This guide breaks down every element of a standard UK greyhound racecard. We start with the visual basics that help you track dogs during a race, move through the biographical and trainer data, then dig into the form figures and timing information that serious racegoers use for analysis. By the end, you will know not just what each number and abbreviation means, but how the pieces connect to give you a complete picture of a greyhound’s current form and racing style.
Trap Colours: The Universal Identification System
Before a race even begins, you need to know which dog is which. Greyhounds racing in the UK wear numbered jackets in standardised colours, and these colours remain consistent across every licensed track in Britain. The system exists because six dogs running at 40 miles per hour around a bend are genuinely difficult to tell apart otherwise. The jackets solve that problem instantly.
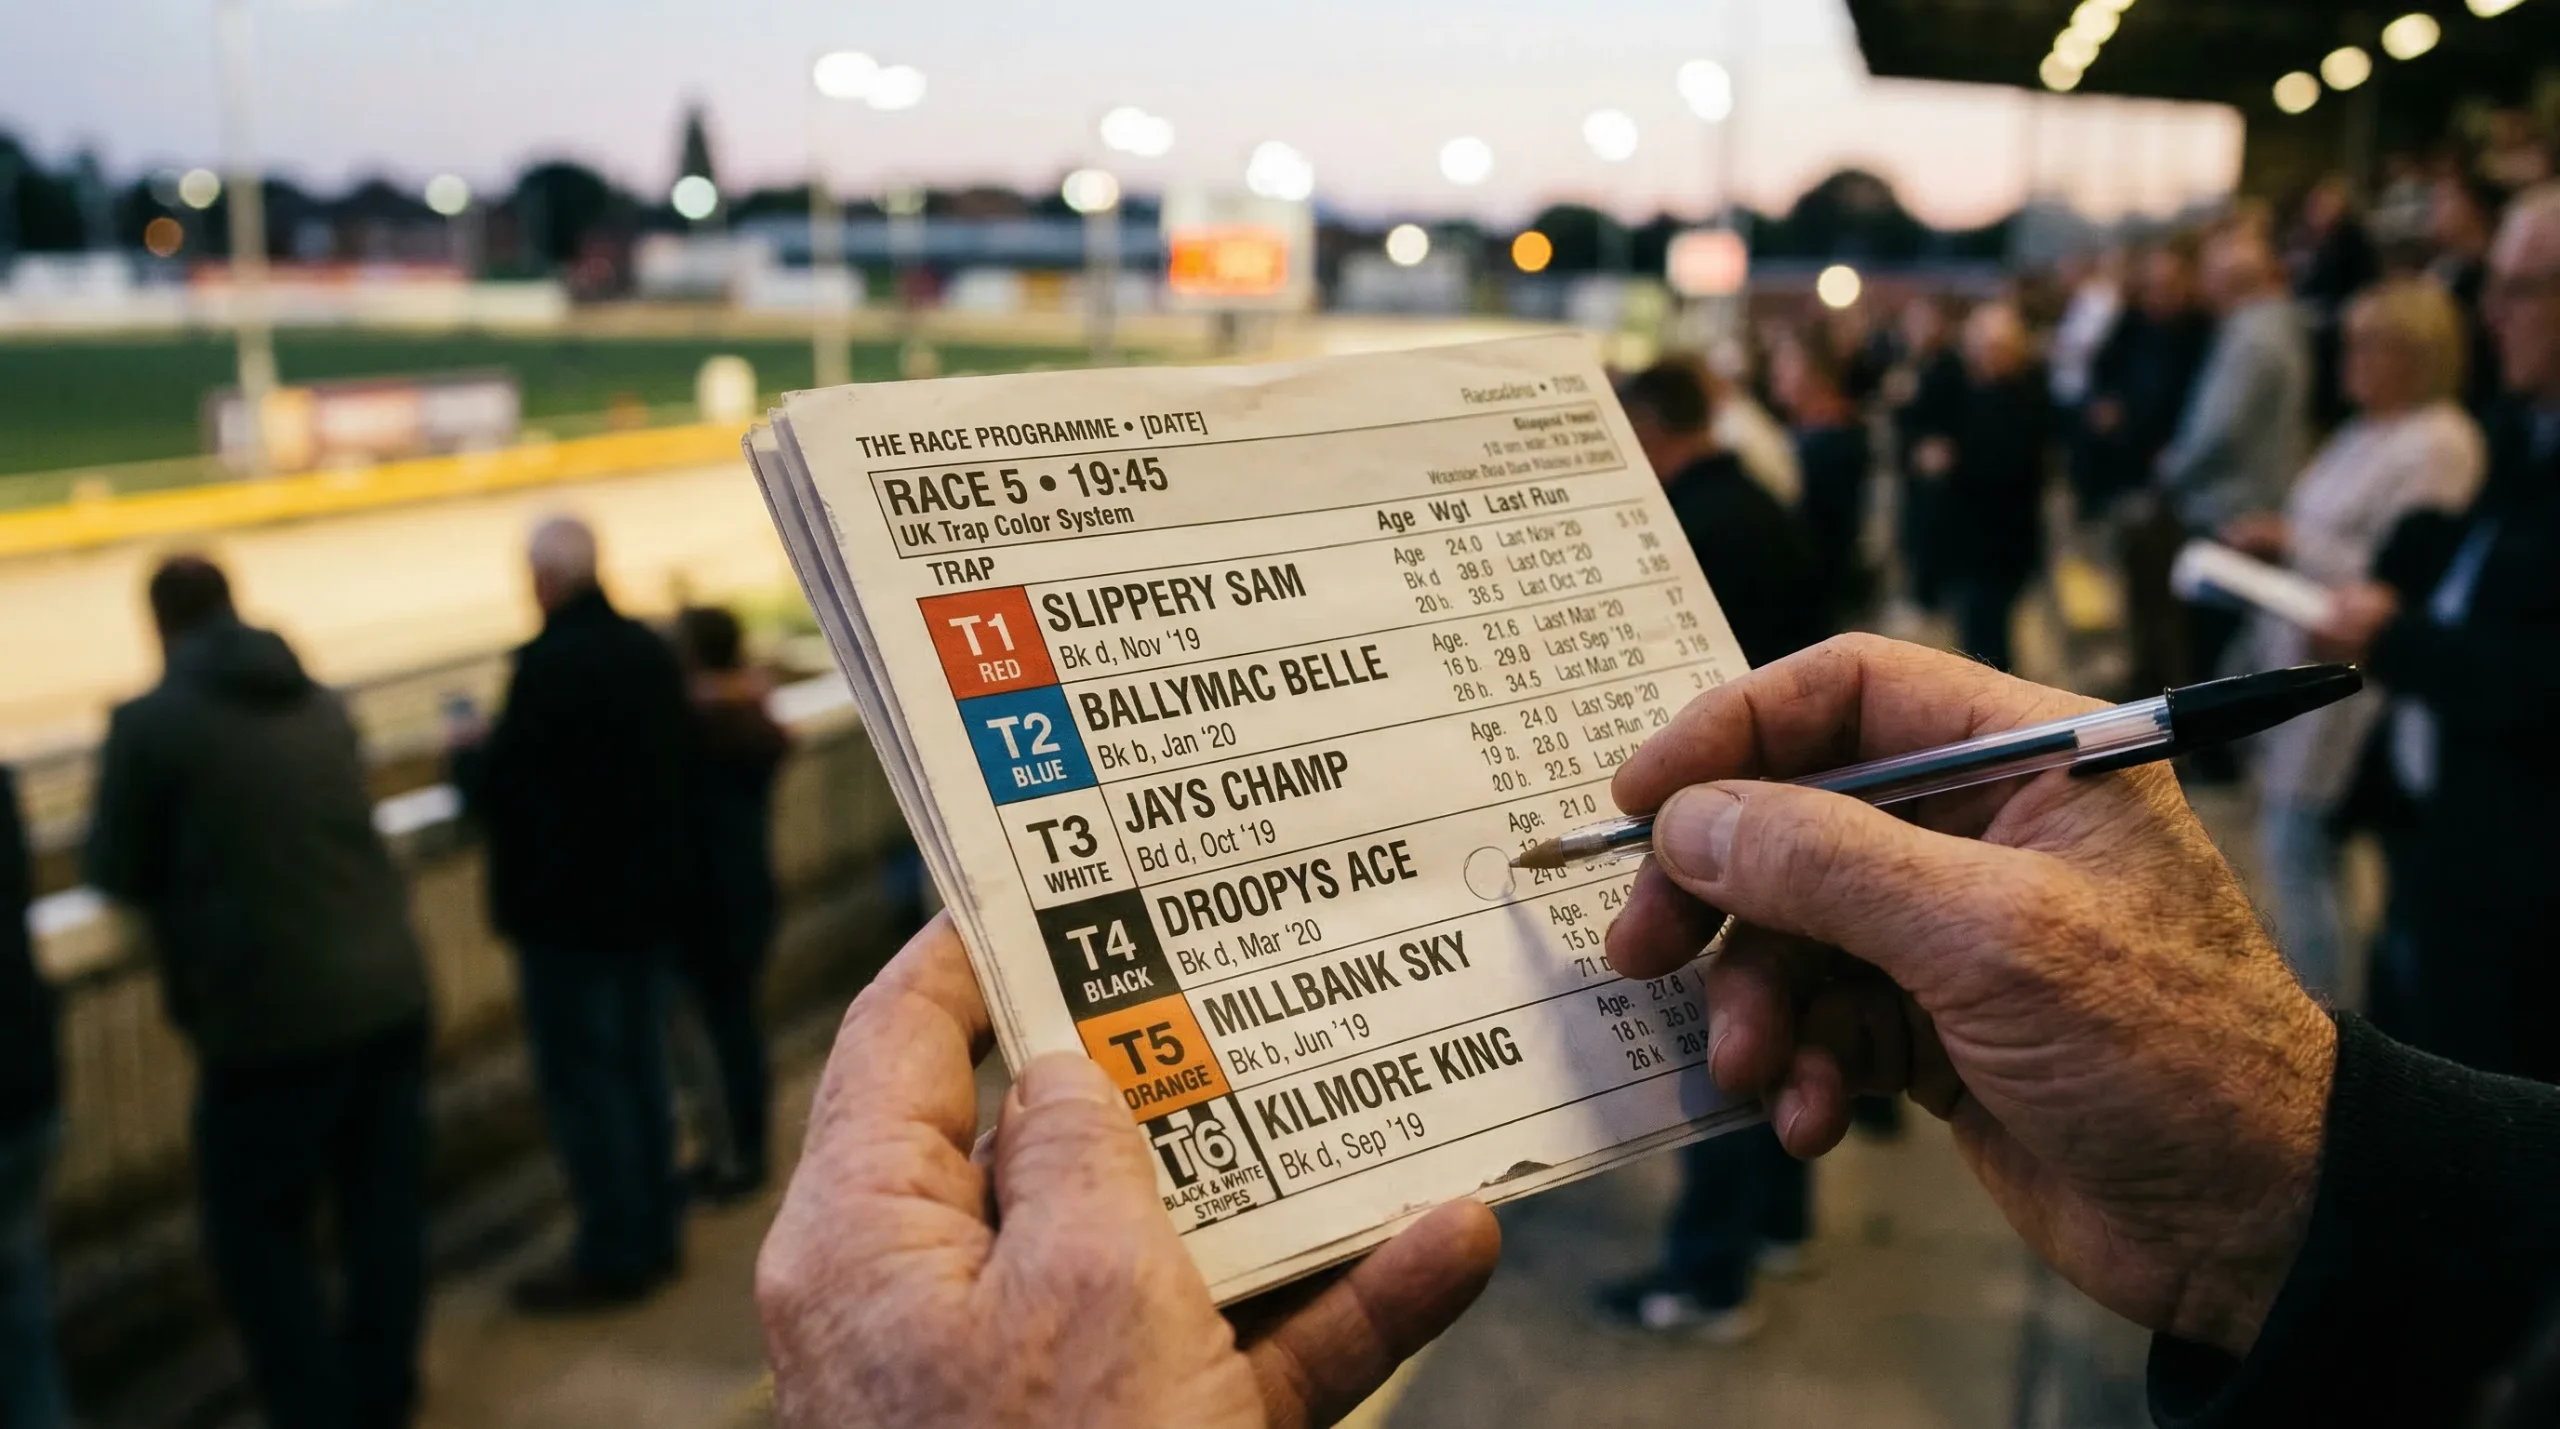
Trap 1 wears red. Trap 2 wears blue. Trap 3 wears white. Trap 4 wears black. Trap 5 wears orange. Trap 6 wears black and white stripes. These assignments never change. A dog starting from trap 1 at Romford wears the same red jacket as a dog starting from trap 1 at Belle Vue. This uniformity means that once you have memorised the colour sequence, you can follow any race at any track without confusion.
The trap number matters beyond mere identification. Dogs are assigned traps based on their running style and previous trap performance. A greyhound with strong early pace and a tendency to run the rails will often be placed in traps 1 or 2, giving it the shortest distance to the first bend. A wide-running dog might fare better from traps 5 or 6, where it has room to run its natural line without causing interference.
When reading a racecard, check whether the dog has raced from this trap number before. Some greyhounds have marked trap preferences, winning readily from certain positions while struggling from others. The form figures often reveal these patterns, showing a string of good results from trap 1 but mediocre performances from trap 6. A dog drawn in its favoured trap has an advantage that does not show up in raw time comparisons.
Television broadcasts and track screens typically display trap colours prominently, and betting slips use the same colour-coding. The system has been in place for decades, and while it seems simple, it is the bedrock of race watching. You cannot analyse a race you cannot follow, and you cannot follow a race if you do not know which colour belongs to which trap.
Greyhound Information: Name, Age, Colour and Pedigree
Every racecard entry begins with the greyhound’s name, usually displayed in bold alongside the trap number. Names follow Irish Greyhound Board and GBGB registration rules, typically combining a kennel prefix with a descriptive or creative suffix. You might see Ballymac Something, Droopys Somebody, or Bubbly variations, each prefix indicating the breeding operation that registered the dog. The names are unique identifiers, and serious racegoers learn to recognise top performers by name alone.
Next to the name, you will find the dog’s colour and sex. Colour codes appear as abbreviations: bk for black, bd for brindle, wbk for white and black, wbd for white and brindle, f for fawn, and various combinations. The sex is indicated as d for dog (male) or b for bitch (female). These details matter less for race analysis than you might expect, though some punters track whether dogs or bitches perform better at certain tracks or distances.
The whelping date tells you the greyhound’s age, shown as month and year of birth. Greyhounds typically begin racing at around 18 months and peak between ages two and four, though individual variation is enormous. An older dog showing consistent recent form deserves more respect than its age might suggest, while a young dog with erratic form might simply be learning its craft. The whelping date also indicates which season the dog was born, which historically influenced early development, though modern kennel practices have reduced this effect.
Pedigree information appears as sire and dam listings. Over 80% of greyhounds racing in Britain were bred in Ireland, meaning you will frequently encounter Irish bloodlines. Certain sires produce sprinters, others produce stayers, and some bloodlines are known for early pace while others tend to finish strongly. Experienced analysts use pedigree data when assessing young dogs or those stepping up to unfamiliar distances. A dog from stayer bloodlines attempting its first 480-metre race warrants different expectations than one bred from pure sprinting stock.
Weight is displayed in kilograms, measured before every race. Greyhounds typically race between 26kg and 36kg, with most falling in the 29-32kg range. What matters more than absolute weight is change from previous races. A dog showing a significant drop in weight since its last run might be unwell or undertrained. A significant gain might indicate it is approaching peak condition or, conversely, that it has become overweight and slow. Most racecards show the weight from the most recent race for direct comparison.
Trainer and Kennel Data
The trainer’s name appears on every racecard entry, and this information carries real analytical weight. Trainers develop reputations at specific tracks, with some kennels excelling at one venue while struggling at another. A trainer based near a particular stadium will run dogs there frequently, learning the track’s quirks and producing better results than their strike rate elsewhere might suggest.
Trainer strike rate measures the percentage of races won over a given period. This data is available through specialist form services and can reveal patterns invisible to casual observers. A trainer with a 15% strike rate might seem average, but if that rate climbs to 25% when running first-time-out dogs, you have identified a training yard that brings greyhounds to the track in ready condition. Conversely, a trainer whose strike rate plummets at certain distances suggests a kennel better suited to different race types.
Recent kennel form matters as much as historical statistics. A yard hitting a purple patch will often produce multiple winners across several days, while a kennel struck by illness or poor form might struggle to place a dog anywhere. The racing press reports major kennel news, and committed racegoers track these developments.
Professional standards among GBGB trainers have risen substantially in recent years. The governing body recorded over 580 hours of continuing professional development completed by industry participants in 2024 alone, covering areas from canine nutrition to injury prevention. This professionalisation means that top trainers increasingly operate with scientific support, using data analysis and veterinary expertise that would have been unthinkable a generation ago.
Some trainers specialise in particular types of dogs. You will find kennels known for developing young talent, others that excel at rehabilitating dogs returning from injury, and some that focus on open-race performers. When a greyhound moves between trainers, its form often changes, sometimes dramatically. A dog struggling in one environment might flourish in another, making trainer transfers worth monitoring closely.
Form Figures: Reading the Recent Race History
The form figures represent the greyhound’s finishing positions in recent races, displayed as a sequence of numbers. A dog showing 112341 finished first in its most recent race, fourth the race before that, third before that, then second, first, and first. The sequence reads from right to left, with the most recent race on the left. Understanding this order is essential because recent form generally matters more than historical results.
Finishing positions from 1 to 6 correspond to the dog’s placing in standard six-runner races. A 0 indicates the dog fell, was injured during the race, or failed to finish. A dash or hyphen means the dog did not race, perhaps due to a reserve run or scratching. Some racecards use letters for specific situations: F for fell, M for moved (referring to re-grading), and T for trial.
Reading form figures requires context. Six straight first-place finishes looks impressive until you notice the dog was racing at A7 grade and has just been promoted to A4. Those wins came against weaker opposition, and the step up in class will test whether the form translates. Conversely, a dog showing 654321 tells a story of steady improvement, building fitness or confidence and peaking at exactly the right moment.
Trap performance within form figures reveals crucial patterns. Many racecards indicate from which trap each finishing position was achieved. A dog that won from trap 1 twice but finished fourth and sixth from traps 5 and 6 might be a one-dimensional railer that struggles when drawn wide. A more versatile performer shows consistent finishing positions regardless of starting trap.
Early-pace indicators often appear alongside form figures, showing where the dog was running at the first bend. A dog that leads to the first bend frequently, indicated by high numbers in the first-bend positions, is an early-pace type that attempts to control races from the front. Dogs showing lower first-bend positions are closers that make up ground late. Neither style is inherently better, but knowing which type you are dealing with helps predict how a race will unfold.
Recent form carries more predictive weight than older results. A dog that won its last three races is a different proposition from one that won three races six outings ago but has disappointed since. Most serious analysts focus primarily on the last three to four runs, treating older form as background information rather than reliable prediction data.
Sectional Times and Pace Analysis
Finishing time alone tells an incomplete story. Two dogs might both clock 29.50 seconds for 480 metres, but one achieved that time by leading throughout while the other came from last at the first bend. Sectional times break the race into segments, typically measuring split times at the first bend and at intervals thereafter. These splits reveal running style and tactical capability that aggregate times obscure.
First-bend times measure how quickly the dog reaches the initial turn. A fast first-bend split indicates early pace, the ability to break sharply from the traps and establish position before crowding becomes problematic. Slow first-bend times suggest a dog that needs room to run, relying on stamina and late speed rather than tactical position. Both approaches can win races, but knowing which type of dog you are examining shapes expectations.
Calculated time differs from actual time and appears on many British racecards. The calculated time adjusts the raw finishing time based on track conditions, producing a standardised figure that allows comparison across different meetings. If the track is running slow due to heavy rain, actual times will be slower than usual, but calculated times account for this, letting you compare today’s performance against last week’s on equal terms.
Track condition data, often called the going, affects times significantly. British tracks use descriptions ranging from fast through standard to slow, with measured values producing precise classifications. The Sports Turf Research Institute conducts regular assessments of licensed tracks, with 80 inspection visits recorded in 2024 across the eighteen GBGB stadiums. These inspections help maintain surface consistency and provide benchmarks for time adjustments.
Comparing sectional times between dogs in the same race previews how the early running might unfold. If two front-runners with similar first-bend splits are drawn beside each other, expect crowding into the first turn. If a confirmed front-runner faces five closers, it might lead unchallenged before being caught late, or it might establish enough early advantage to hold on. The sectional data, combined with trap draws and form figures, paints a picture of race dynamics before the traps open.
Comment Abbreviations: The Language of Race Reports
Race comments use standardised abbreviations to describe what happened during a run. These compressed observations explain why a dog finished where it did, providing context that finishing positions alone cannot convey. Learning this vocabulary transforms your ability to assess form, revealing whether poor results stemmed from bad luck or genuine inability.
SAW means slow away, indicating the dog broke poorly from the trap and lost ground at the start. A dog showing SAW in its last three races might have a trapping problem, a genuine deficiency that costs it positions. However, SAW appearing once amid otherwise clean breaks suggests an isolated incident rather than a pattern. Context matters enormously when interpreting these codes.
Ld indicates the dog led at some point during the race, while Ld1 specifies it led at the first bend. These markers identify front-runners and provide data for pace analysis. A dog showing Ld in every race is a confirmed leader type that needs to control proceedings. If it also shows phrases like Chl (challenged) or Ld-Hdd (led then headed), you know it can lead but sometimes lacks the stamina or determination to hold on.
Crd stands for crowded, meaning the dog encountered interference from other runners. Bmp indicates it was bumped, struck by another greyhound during the race. Ck means checked, a more severe interference that caused the dog to break stride or lose significant ground. These abbreviations explain away poor finishing positions. A dog that finished fifth after being badly crowded at the first bend might have won with a clear run, making the 5 in its form figures misleading.
Rls means the dog ran the rails, staying close to the inside barrier, while Wd indicates it ran wide, taking an outside path around the track. RnOn tells you the dog ran on strongly at the finish, finding extra speed in the closing stages. RnUp means it ran up close behind the leaders without quite getting there. Fll indicates a fall, corresponding to a 0 in the form figures and requiring careful assessment before the dog’s next outing.
Brt identifies a bright performance, a race where the dog showed particular promise. This subjective assessment from the race grader suggests the run was better than raw positions might indicate. At the opposite end, phrases like Nv Nr (never nearer) indicate a dog that was always struggling and never threatened to improve its position.
Additional abbreviations cover specific circumstances: MidDiv places the dog mid-division through the race, ALd means always led, QAw indicates a quick away from the traps, and Stb means stumbled. Some cards use EvCh (every chance) to indicate a dog that had opportunities to win but failed to take them, suggesting a potential confidence or determination issue.
Reading several races’ worth of comments in sequence reveals patterns. A dog repeatedly showing Crd and Bmp might be unlucky or might be a poor racer that runs into trouble through its own lack of track sense. A dog consistently showing Rls followed by RnOn has a defined running style, useful information when predicting how it will handle different trap draws.
Putting It All Together: Practical Racecard Analysis
Reading individual data points is the first step. Synthesising them into a coherent assessment of each runner is where racecard analysis becomes genuinely useful. A systematic approach examines trap draw, recent form, running style, trainer form, and any extenuating circumstances suggested by race comments. Considered together, these elements produce a multi-dimensional picture of each contender.
Start with the draw. Identify which dogs have trap preferences and whether today’s draw suits them. Note any potential first-bend conflicts, such as two early-pace dogs drawn beside each other or a wide-runner stuck in trap 1. The draw alone eliminates some contenders and elevates others before you consider anything else.
Assess recent form in context. A dog winning at a lower grade earns credit but faces a class test today. A dog returning from a break requires careful examination of its last run before the absence. Weight changes exceeding a kilogram merit attention, particularly losses that might indicate health issues. Time away from racing could mean injury recovery, in which case the dog might need a run or two before reaching peak form.
Consider the trainer’s current run. Is the kennel striking well at this track? Has it produced winners this week? Trainers on a roll often know their dogs are peaking, placing them where they can win. Trainers whose dogs have been disappointing might be working through a difficult period that affects multiple runners.
Running style shapes race dynamics. Count the early-pace dogs and the closers. A race with one confirmed front-runner and five moderate beginners often favours the leader, who can dictate the race unchallenged. A race packed with early speed might produce crowding at the first bend, bringing closers into the frame who could not compete if the pace was more settled.
Factor in race comments from recent outings. Did any dog encounter trouble that explains an otherwise disappointing run? Did any dog receive glowing assessments suggesting improvement is coming? These qualitative judgments, made by people watching the races live, add texture that pure numbers cannot capture.
The professionals who make a living from greyhound form analysis describe their work as combining pattern recognition with information weighting. The pattern recognition comes from experience, from having seen thousands of racecards and learning which combinations tend to produce which outcomes. The information weighting involves knowing which factors matter most in which circumstances, something that varies by track, distance, grade, and conditions.
Form services such as Timeform and specialist websites like Greyhound Stats provide pre-packaged analysis for those who prefer not to work through the raw data themselves. These services rate each runner, highlight key form indicators, and offer summary assessments. Whether you use these services or prefer your own analysis, understanding the racecard data they draw upon makes their conclusions meaningful rather than mysterious.